I have been using PHP-FPM to interpret the PHP language program for years. My server or VPS is powered by Ubuntu, most time the latest LTS version or the second latest version. I like Nginx for web servers. In the title I said php-fpm. It could be php8.2-fpm, php8.1-fpm. The different version of php-fpm has different names.
Now this post is about how to add the PHP-FPM status page to the web.
Enable php-fpm Status page
SSH to the VPS, find the file, /etc/php/8.2/fpm/pool.d/www.conf
sudo nano www.conf
Located pm.status_path = /status
Remove the # to un-comment it.
Then run the command to restart the php8.2-fpm service.
sudo service php8.2-fpm restart
Edit the Nginx Web server settings
My website configuration files are located in /etc/nginx/conf.d/
sudo nano mysite.conf
Add following into the server block.
location ~ ^/(status|ping)$ {
access_log off;
allow 127.0.0.1;
allow your-ip-address;
deny all;
fastcgi_index /php-fpm/status;
fastcgi_param SCRIPT_FILENAME $realpath_root$fastcgi_script_name;
include fastcgi_params;
fastcgi_pass unix:/var/run/php/php8.2-fpm.sock;
# fastcgi_pass 127.0.0.1:9000;
}
Look at the code above carefully.
1) Replace your-ip-address with your IP address. It will only allow you to access this status page.
2) Choose the way you use php-fpm. I am using a socket connection. If you are using a TCP connection, you should modify the code above.
Then restart the Nginx server.
sudo service nginx restart
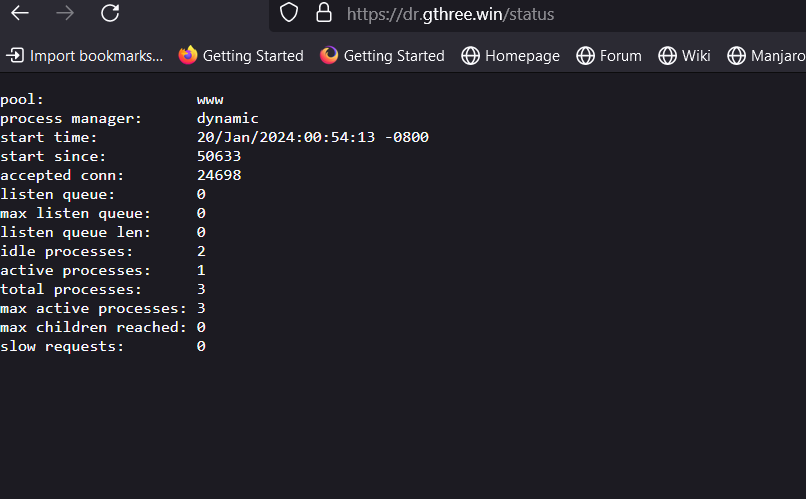
Go to the desktop browser to load the status web page.
pool:                 www
process manager:      dynamic
start time:           20/Jan/2024:00:54:13 -0800
start since:          51012
accepted conn:        24883
listen queue:         0
max listen queue:     0
listen queue len:     0
idle processes:       2
active processes:     1
total processes:      3
max active processes: 3
max children reached: 0
slow requests:        0
There are also more details status page.
Examples for summary status page:
http://example.com/status
http://example.com/status?json
http://example.com/status?html
http://example.com/status?xml
Example for detailed status page:
http://example.com/status?full
http://example.com/status?json&full
http://example.com/status?html&full
http://example.com/status?xml&full
You can use json or xml format to process status page output programatically. HTML is useful when viewing detailed status report.
The PHP official docs page.
Definations
- pool – the name of the pool. Mostly it will be www.
- process manager – possible values static, dynamic or ondemand. We never use static. Trying ondemand is on todo list.
- start time – the date and time FPM has started or reloaded. Reloading PHP-FPM (service php8.2-fpm reload) reset this value.
- start since – number of seconds since FPM has started
- accepted conn – the number of request accepted by the pool
- listen queue – the number of request in the queue of pending connections. If this number is non-zero, then you better increase number of process FPM can spawn.
- max listen queue – the maximum number of requests in the queue of pending connections since FPM has started
- listen queue len – the size of the socket queue of pending connections
- idle processes – the number of idle processes
- active processes – the number of active processes
- total processes – the number of idle + active processes
- max active processes – the maximum number of active processes since FPM has started
- max children reached – number of times, the process limit has been reached, when pm tries to start more children. If that value is not zero, then you may need to increase max process limit for your PHP-FPM pool. Like this, you can find other useful information to tweak your pool better way.
- slow requests – Enable php-fpm slow-log before you consider this. If this value is non-zero you may have slow php processes. Poorly written mysql queries are generally culprit.
Here is a sample of full detailed status page in HTML format.

Meaning of the items.
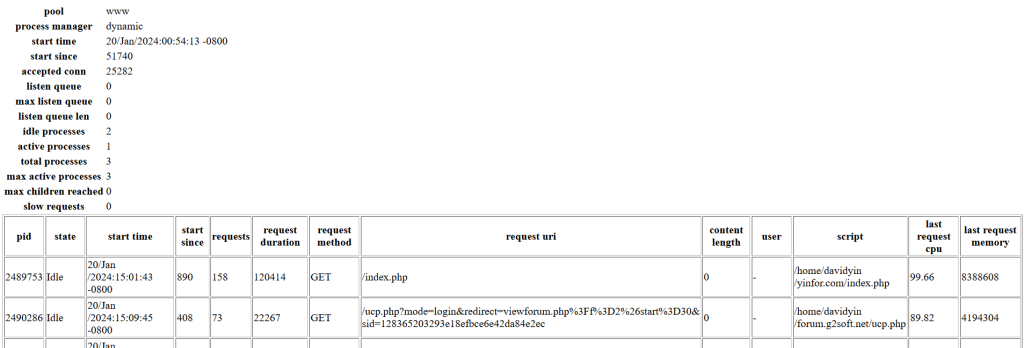
- pid – the PID of the process. You can use this PID to kill a long running process.
- state – the state of the process (Idle, Running, …)
- start time – the date and time the process has started
- start since – the number of seconds since the process has started
- requests – the number of requests the process has served
- request duration – the duration in µs of the requests
- request method – the request method (GET, POST, …)
- request URI – the request URI with the query string
- content length – the content length of the request (only with POST)
- user – the user (PHP_AUTH_USER) (or ‘-‘ if not set)
- script – the main PHP script called (or ‘-‘ if not set)
- last request cpu – the %cpu the last request consumed. it’s always 0 if the process is not in Idle state because CPU calculation is done when the request processing has terminated
- last request memorythe max amount of memory the last request consumed. it’s always 0 if the process is not in Idle state because memory calculation is done when the request processing has terminated
Getting the php8.2-fpm status page is one of the steps to prepare for php optimization. I need more data to analyze and make a decision.